

Weekly Newsletter
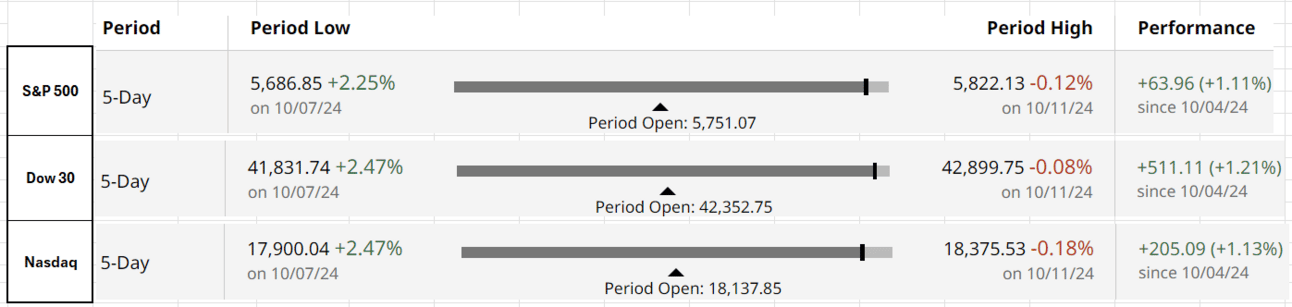
All Three Indices Up More Than 1.1% for the Week
Summary of September FOMC Meeting Minutes
Inflation (PCE) Projection for Oct. 31st Release
Info About the Premium for Job Switchers vs. Job Stayers
Basis Trade Causes End-of-Quarter Funding Pressure
US Stock Market Cap Dominance
QUOTE OF THE WEEK:
“The debt to GDP was 35% in 1982, but it's 100% today. The deficit say the biggest peacetime deficit you ever ran. Deficits, by their nature, are inflationary. And, you know, one point we have to deal with this.” Jamie Dimon, CEO, JP Morgan Chase.
KEY US ECONOMIC EVENTS NEXT WEEK:

Source: ForexFactory
MARKET CLOSE:

EOD 10/11 - CNBC
Good Afternoon. The S&P 500 and Dow Jones Industrial Average hit new highs on Friday, boosted by solid bank earnings, capping a winning week. The Nasdaq Composite also gained, nearing its all-time high.
For the week:
The S&P 500 is up 1.11%, the Nasdaq is up 1.13%, and the Dow 30 is up 1.21%.
Source: barchart
CNN's Fear & Greed Index is flat for the week at 74 (Greed) out of 100. Details here
The top five trending stocks on Reddit are Tesla, Nvidia, SPY, MicroStrategy, and Trump Media. Read More
Here is a summary of this week’s key economic releases:

Unemployment benefit claims in the U.S. surged to 258,000, the highest since Aug. 2023. This rise is considered mainly due to Hurricane Helene and the Boeing machinist strike rather than a broader labor market decline.
The consumer price index (CPI) rose 0.2% in September, with annual inflation at 2.4%, both slightly above forecasts. Core prices, excluding food and energy, increased 0.3%, bringing the annual core inflation rate to 3.3%.

The Federal Reserve prefers the personal consumption expenditures price index (PCE) over the CPI, but the softening in the CPI indicates that inflation continues to fall as expected. On Friday, Goldman Sachs projected the PCE to be at 2.04% when released later this month, on October 31st, i.e., achieving the Fed target.


Target Rate Probabilities for Nov 7th FOMC Meeting:

CME FedWatch: * Data as of 12 Oct 2024 07:39:59 CT

FRONT PAGES:
Tesla shares dropped after the robotaxi event disappointed investors. CEO Elon Musk unveiled the Cybercab, priced under $30,000, but analysts at Barclays noted the event lacked focus on near-term opportunities, emphasizing Musk's long-term vision for autonomous driving. Read More
Boeing to cut 17,000 jobs (10% of its global workforce), delay the 777X jet deliveries by a year, and record $5 billion in third-quarter losses amid a prolonged strike. Read More
U.S. corporate credit spreads have recently fallen to multi-year lows, reflecting growing investor confidence. Read More
Swing states are facing financial stress than the rest of the country. Credit card delinquencies and rent increases, both key measures, are higher in most states than the national average. This generally hurt the incumbent government’s reelection chances. Read More

Source: Bloomberg

EARNINGS UPDATE:
PepsiCo lowered its 2024 guidance due to weaker-than-expected North American sales despite reporting strong quarterly earnings. Read More
JPMorgan Chase's third-quarter revenue rose 6%, while profit fell 2%. Net interest income increased 3%, surpassing estimates, driven by gains in securities investments and credit card loan growth. Read More
Wells Fargo's third-quarter profit surpassed analysts' expectations as the bank set aside less than anticipated for potential loan losses and forecasted stable interest income. Read More
BNY exceeded third-quarter profit estimates, driven by higher investment services fees as assets under custody and administration surpassed $50 trillion for the first time. Read More
EARNINGS PREVIEW:
Date | Symbol | Name | Time |
10/15/2024 | BAC | Bank of America Corp | Before Open |
10/15/2024 | C | Citigroup Inc | Before Open |
10/15/2024 | GS | Goldman Sachs Group | Before Open |
10/15/2024 | JNJ | Johnson & Johnson | Before Open |
10/15/2024 | UNH | Unitedhealth Group Inc | Before Open |
10/16/2024 | ABT | Abbott Laboratories | Before Open |
10/16/2024 | ASML | Asml Holdings NY Reg ADR | Before Open |
10/17/2024 | ISRG | Intuitive Surg Inc | After Close |
10/17/2024 | MS | Morgan Stanley | Before Open |
10/17/2024 | NFLX | Netflix Inc | Before Open |
10/17/2024 | TSM | Taiwan Semiconductor ADR | Before Open |
10/18/2024 | AXP | American Express Company | Before Open |
10/18/2024 | PG | Procter & Gamble Company | Before Open |
CURATED INSIGHTS:
Sticky Services Inflation: The graph below from Bloomberg highlights the higher services inflation. The sharp rise in inflation a year after the pandemic was mainly driven by everything else (i.e., energy, food, and core goods), which has come down now and is even lower than the pre-pandemic levels. However, service inflation remains elevated.
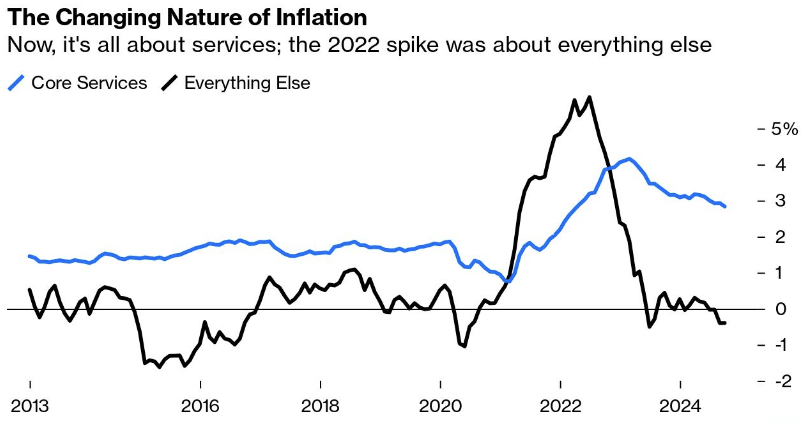
Source: John Authers, Bloomberg
Wages mainly drive service inflation. Recent macro data suggest that the labor market is softening, which will be crucial in reducing sticky services inflation.
Not A Good Time to Change Job: The data below shows that wage growth in the US is slowing down, but it's at 5%, which is much higher than the ~3.5% pre-pandemic range. As per the below, the best time to change jobs was late 2022, as the premium for job switchers vs. job stayers was 2.2%, now reduced to 0.5%. This trend needs to be sustained to bring down sticky services inflation.
Source: Atlanta Fed


Basis Trade Drives Funding Pressure: According to Fed data, the overnight repo (Secured Overnight Funding Rate aka SOFR) volume hit a record $2.5 trillion on Sept. 30, up from $2.07 trillion the previous day. Treasury repos cleared through the DVP platform also surged to $1.7 trillion and have remained in the trillions recently. The SOFR increased to 5.05% on Oct 1st. It has come down since then and now stands at 4.82% on Oct 10th.
Analysts attribute the spike to an increase in basis trades. This strategy exploits the price gap between cash treasuries and futures, financed through the repo market, driven by record short positions in treasuries futures by leveraged funds. Read MoreThe below graph shows the SOFR steadily around ~4.8% post-first Fed rate cut but suddenly shot up at the September quarter end.
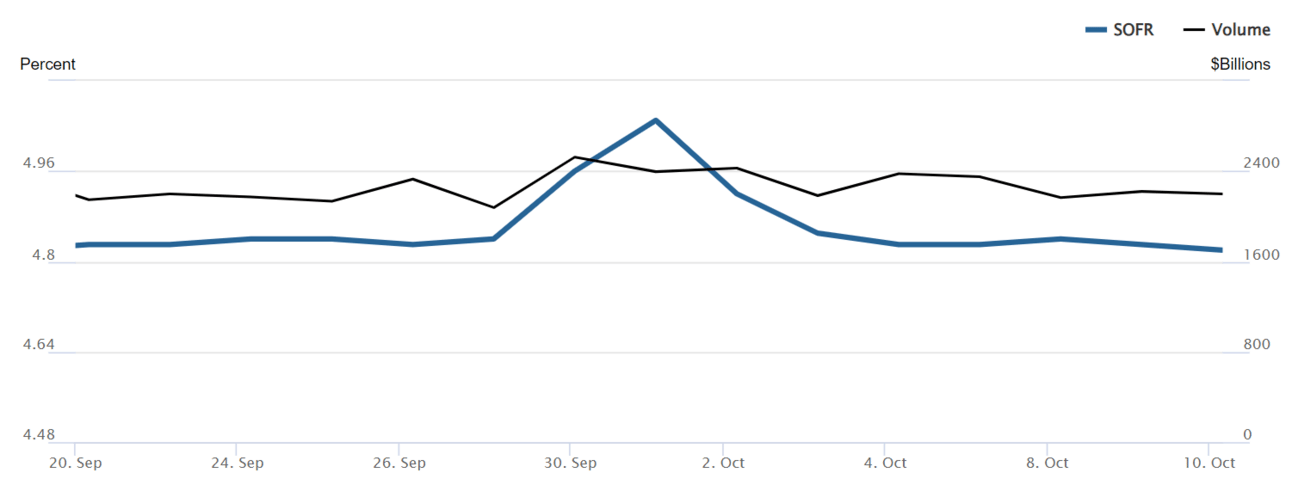
Source: NY Fed
On Sept. 26th, a few days before this SOFR spike, the NY Fed hosted the 10th U.S. Treasury Market Conference, which discussed the ongoing developments in the US Treasury market and solutions (such as central clearing) to improve its functioning or in a way avoid events such as the one happened earlier this month.
FOMC Meeting Minutes (Sept. 17-18, 2024): Key points from the meeting minutes released this week are below. These show the staff view and economic and financial situation, which led to the 50bp cut in this meeting -
The GDP expanded solidly, the unemployment rate increased but remained low, and the CPI was well below a year before.
The staff estimated the PCE to be 2.2% and core PCE to be 2.7% over the 12 months ending in August.
The average hourly rate increased but was well below their pace from a year before.
Market-based measures of interest rate uncertainty in the near term rose notably, reflecting the increased concerns among investors about downside risks to the economy.
The unemployment rate is expected to remain roughly flat from 2025 to 2027. By 2026, total and core PCE is expected to be 2%.
Some participants raised concerns over increased credit card delinquencies. Read More
Rise In US Stock Market Capitalization:
Torsten Slok at Apollo highlighted the fact below this week. During the Great Financial Crisis in 2009, the US market cap was 30% of the global stock market cap. Today, it’s close to 50%.
Source: Apollo
This is a significant graph; below are some key points to note:
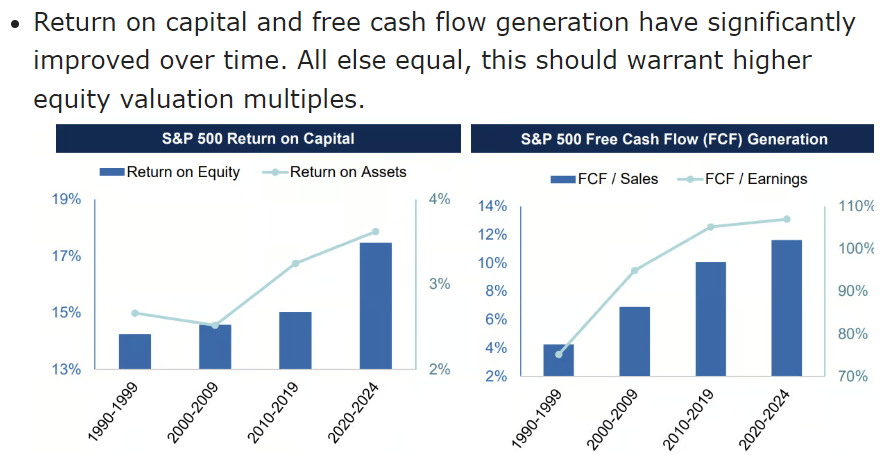
Overvaluation in the US? - It might seem that US markets are overvalued compared to the rest of the world. However, I don’t think it’s that straightforward. If you notice, the US market cap was 45% of the global stock market in 2003. It dropped to 30% during the 2008 crisis and took 15 years to reach the old levels. Also, please note the screenshot below from my July 21st newsletter, which explains higher valuations in the US. So, there are fundamental reasons for this US dominance. There may be overvaluation in some areas of the US markets, but primarily, it’s fundamentals driven due to productivity, innovation, and fiscal support:
Source: Alger, Primal Thesis Newsletter
The Rest of the World is Not Doing Good: This is mainly true. Look at China, Japan, Europe, or Russia. All major economies are struggling for multiple reasons, and their underperformance is reflected in this market cap trend.


VIDEO’s OF THE WEEK:
Subscribe to my Newsletter here.
Also, check my blog here.
This newsletter's content is for informational and educational purposes only and should not be considered trading or investment recommendations. All the opinions in this newsletter are personal and do not belong to any organization.