

AFTER-HOURS

Source - CNN
KEY US ECONOMIC EVENTS NEXT WEEK

Source - Forex Factory
MARKET CLOSE

Source - CNBC
Good Afternoon. I am still traveling this week, so due to limited time, I tried to cover a few things at a high level in this newsletter.
This week was action-packed. S&P 500 sold off on Monday, registering its biggest single-day loss since 2024. However, just three days later, on Thursday, the S&P 500 marked the biggest daily gain for the index so far in 2024. So, markets closed for the week, and they were almost flat. On Monday, the VIX index rose above 65, which is a rare occurrence signaling serious panic. However, after analyzing this week’s actions, I think the VIX spike was due to technical reasons rather than the actual panic caused by some troubles with the US economy.
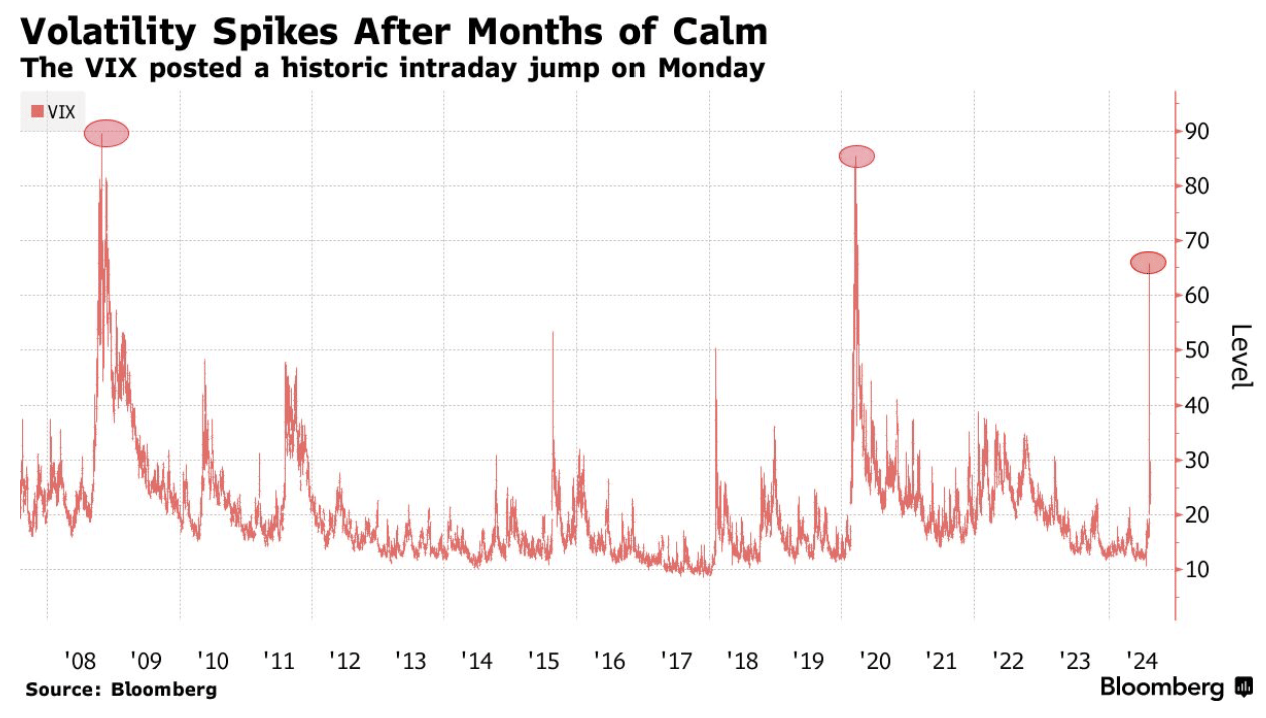
Source - Bloomberg
What caused the market panic? Multiple factors led to Monday’s sudden rise in volatility and extreme selling as below -
The backdrop was set with the weak US economic data and key mag 7 company (MSFT, GOOG, AMZN) earnings a week before failing to support the euphoria.
Yen Carry Trade unwinding- BoJ suddenly announced that it’s raising the policy rates from historically low levels. For decades, the rates in Japan were at 0%, so many institutions used to borrow free cash from Japan and invest in risky assets all over the world. The sudden policy change by BoJ caused panic among these institutional investors as they now need to pay the yen they borrowed to invest. Hence, these funds started selling, which triggered the below yen carry loop. As the yen appreciates, the borrowed cash becomes more expensive for these investors, which triggers further panic.
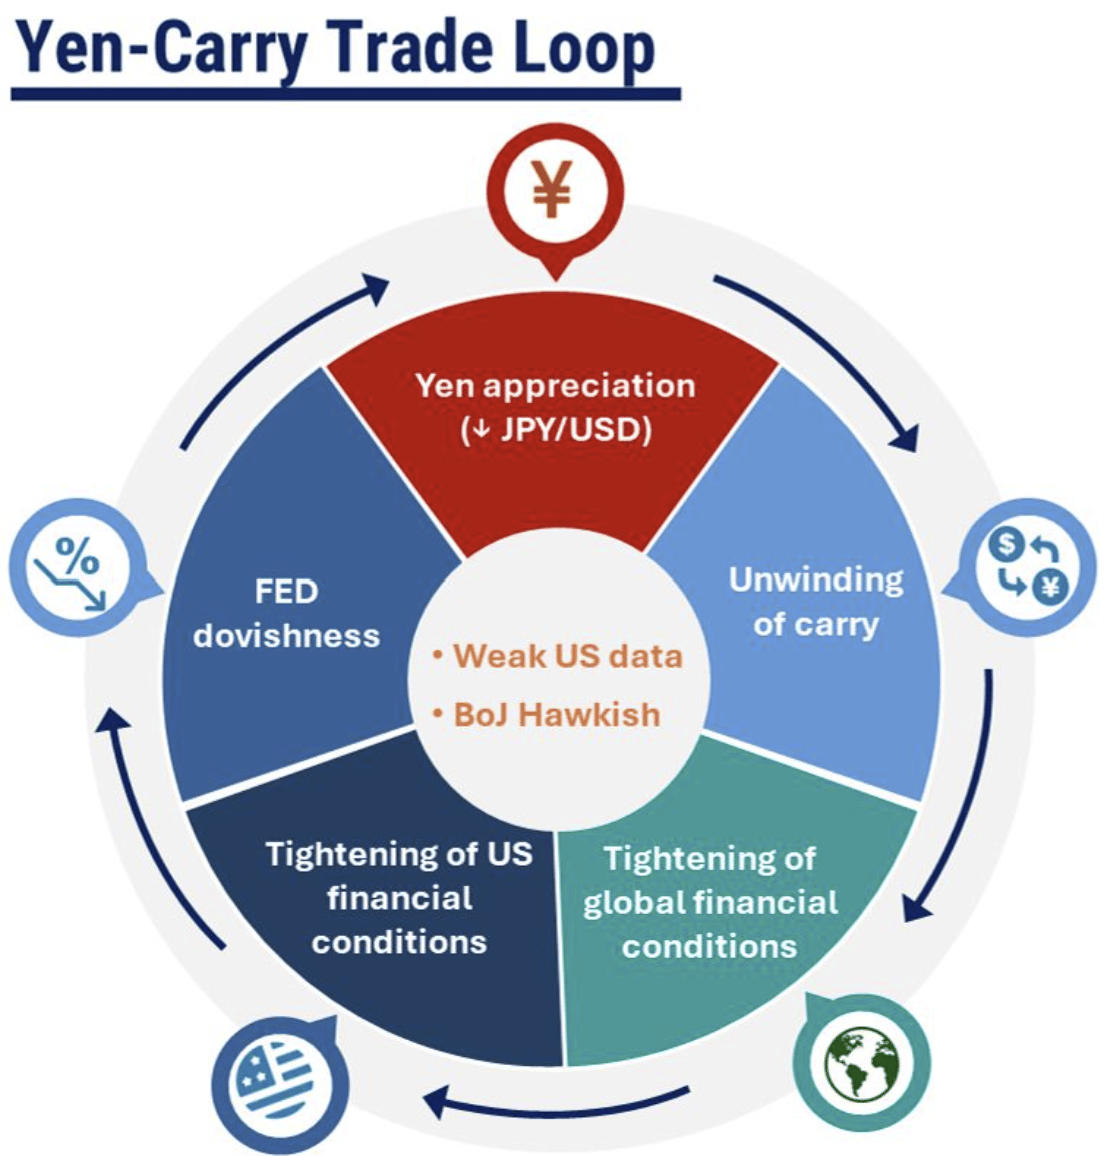
Source: Gianluca Benigno
The yen carry trade unwinding triggered a domino effect -
Level of demand for puts shot up (check the second video in the below section)
Potentially volatility-linked funds sold stocks are per their strategy, as feared in this Reuters article the week before
The way the VIX index is calculated also contributed to this sudden spike. In short, the lack of liquidity increases the bid-ask spread of SPY options contracts, which is a key factor in calculating VIX. On Monday, the VIX futures contract noted a much lesser increase than the VIX index itself. Please check this Bloomberg article to understand more details.
What stopped the Yen carry loop?
The BoJ came under pressure due to the worst sell-off in Japanese markets in 50 years and announced that it wouldn’t raise rates when markets are in turmoil. This helped with yen-carrying unwinding pressure.
In the US, economic data released this week was also good, i.e., a better-than-expected Institute for Supply Management report on the services sector, the decline in initial jobless claims, etc.
Overall, it appears that this week's spike in volatility was more due to technical reasons and not purely due to concerns that the US economy is falling into recession. Markets will be very sensitive to the key economic data next week. Currently, the USD/JPY exchange rate seems to be stabilized and expected to be in the range. However, if Yen starts strengthening again, it can bring equities down again. The USD/JPY pair is one of the most closely watched markets right now. The Nvidia earnings later in the month are also another big event that will decide the direction.
As covered in last week’s newsletter, a proactive Fed rate cut of 25bp would have helped ease some of these pressures. However, it is good that the Fed did not give in to the market pressure (as the BoJ) and did not announce an emergency rate cut outside the formal Fed meeting cycle, i.e., FOMC day. That would have caused more panic. It would have been perceived as the Fed confirming real issues with the economy.
Market performance for the week: Nasdaq -0.18%, S&P500 -0.04%, Dow30 -0.60%, and Russell2000 -1.18%.
CNN's Fear & Greed Index now stands at 24 (Fear) out of 100, a drop of 3 points from last week.
The top five trending stocks on Reddit are Nvidia, SPY, Intel, VOO, and QQQ.


FRONT PAGES
The S&P 500 was little changed for the week after regaining almost all of its losses since Monday's steep dive that was prompted by fears of a recession and unwinding of a global yen-funded carry trade.
The average rate on the popular U.S. 30-year mortgage plunged to its lowest level since May 2023 this week, following days of market turbulence resulting from last week's softer-than-expected employment report.
A drop in the number of Americans applying for unemployment benefits last week relieved markets that had been in a near panic about prospects for a recession.
Bank of Japan gave in to the pressure. The deputy governor, Shinichi Uchida, delivered a fresh message this week — rate hikes were off the table so long as markets were in turmoil.
Palantir announced a partnership with Microsoft to deliver services for classified networks in US defense and intelligence agencies.
A federal U.S. judge ruled Monday that Google has illegally held a monopoly in search and text advertising. The court homed in on Google’s exclusive search arrangements on Android and Apple’s iPhone and iPad devices.
Hindenburg alleges India's market regulator chief held a stake in offshore funds used by Adani Group.
EARNINGS UPDATE
Amgen’s second-quarter profit slipped 1% as higher expenses, including costs related to the development of its experimental obesity drug MariTide, offset a 20% increase in revenue driven by the biotechnology company's October acquisition of rare disease drugmaker Horizon Therapeutics.
Uber’s second-quarter results beat Wall Street estimates on the back of steady demand for ride-sharing and food-delivery services.
Caterpillar beat Wall Street estimates for second-quarter profit on Tuesday. Higher prices and easing manufacturing costs countered moderating demand for the company's heavy equipment across its major markets.
Disney beat analyst estimates for revenue and earnings. The company’s combined streaming businesses, which are Disney+, Hulu, and ESPN+, made a profit for the first time and beat Disney’s earlier guidance that this would happen in the fourth quarter. Disney’s parks and experiences segment felt pressure due to lower consumer demand and inflation.
Eli Lilly reported second-quarter earnings and revenue that blew past expectations. It hiked its full-year revenue outlook by $3 billion as sales of its blockbuster diabetes drug Mounjaro and weight loss injection Zepbound spike.
EARNINGS PREVIEW
Date | Symbol | Name | Time |
8/13/2024 | HD | Home Depot | Before Open |
8/15/2024 | BABA | Alibaba Group Holding ADR | After Close |
8/15/2024 | WMT | Walmart Inc | Before Open |
CURATED INSIGHTS
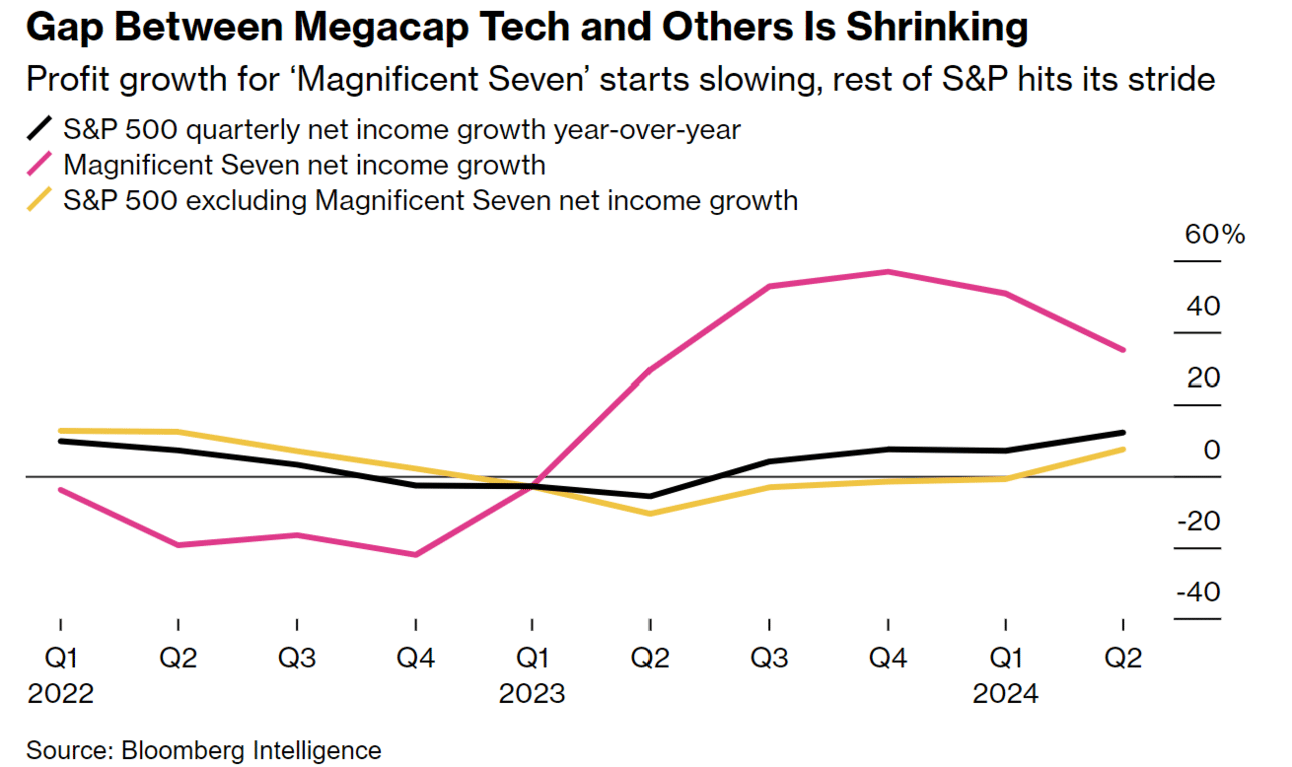
Bloomberg Intelligence data shows that Earnings Growth in the US is finally showing up outside tech megacaps. S&P 500 earnings ex-Mag-7 are set to grow 7.4% in 2Q. This is a good data point and further indicates that the soft landing is a more probable scenario for the US if the broader set of companies are reporting growth in profitability.
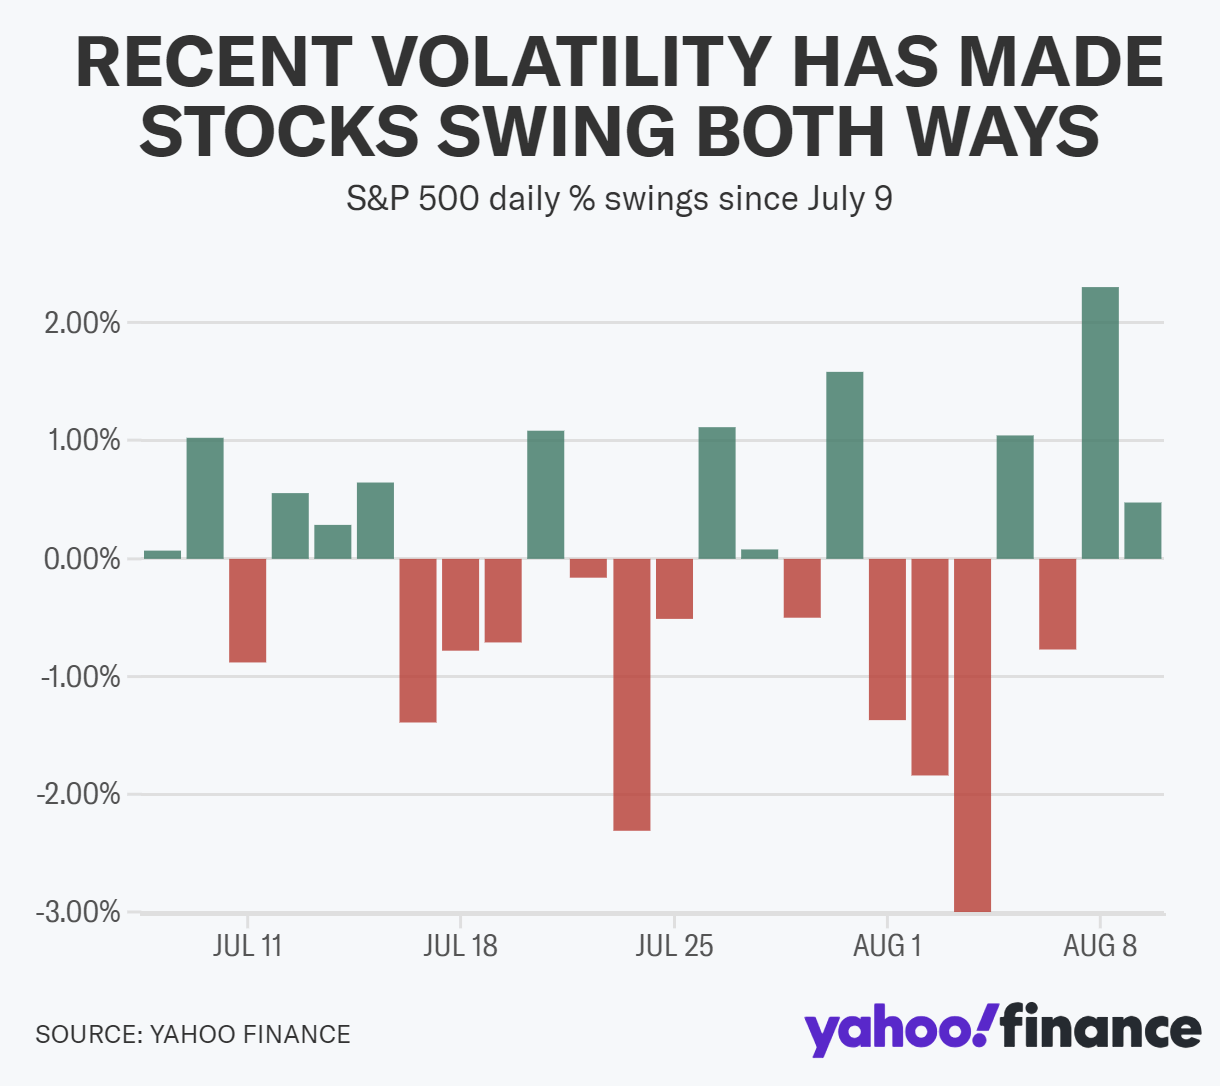
The rise in volatility since mid-July is swinging the markets both ways, as this chart from Yahoo Finance shows. A rise in volatility generally wipes out one to three months of returns based on historical data.
Berkshire Hathaway now holds 25% of its Assets in Cash, the highest percentage since 2004. The historical average cash position is 14%. However, as shown in the chart below, Berkshire had raised cash allocation to levels higher than the current levels in the past, so Berkshire's current positioning is not totally unusual. Valuations have been stretched in recent times, and Buffet is well known for investing only at the right valuations, so it’s not surprising that he may not have found any good opportunities. Also, he is earning ~5% on his cash without doing anything, which is not bad when you have close to $300bn, i.e., ~$15bn interest income for not doing anything.
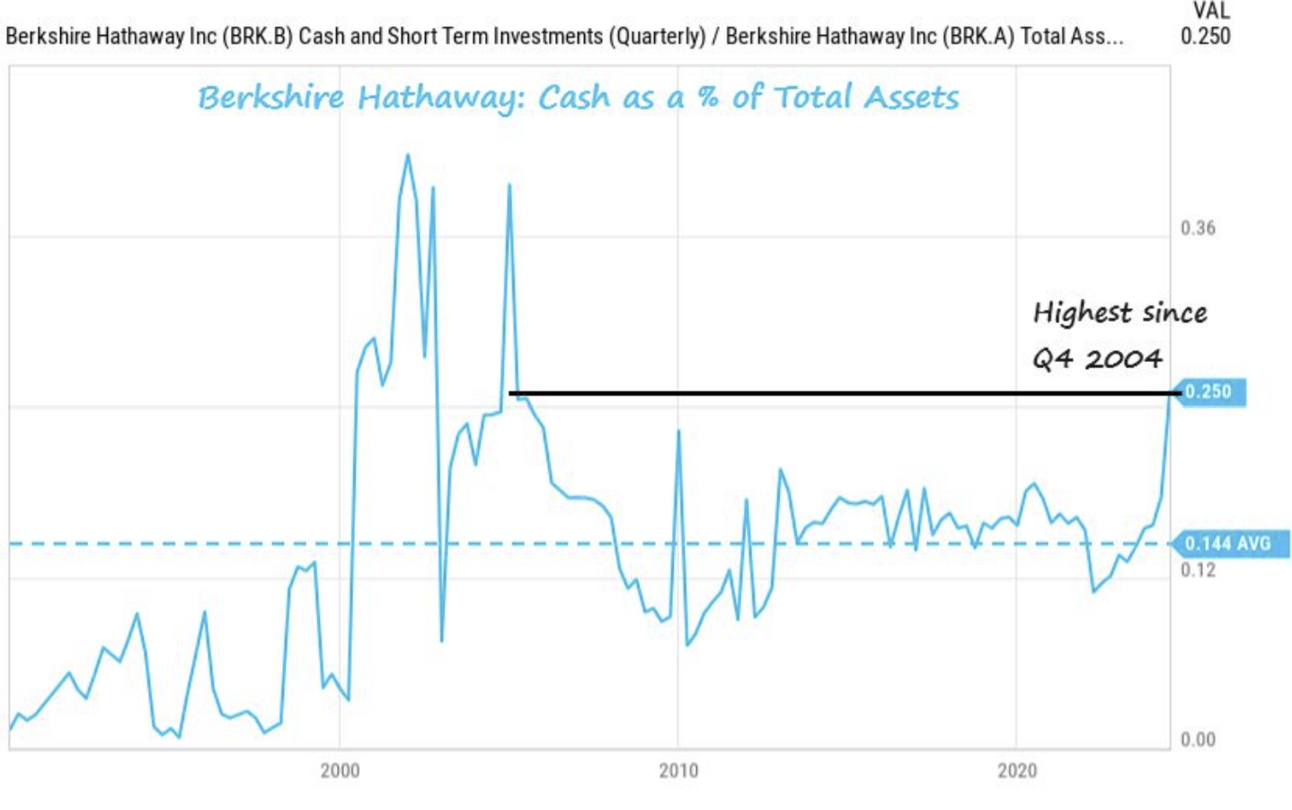
Source: YChart and Charlie Bilello


VIDEO’s OF THE WEEK
Find past newsletter archives here.
This newsletter's content is for informational and educational purposes only and should not be considered trading or investment recommendations.